

Microsoft Deep-Dive: Microsoft Isn’t 39× Free Cash Flow. On Owner’s Earning, It’s 21×
Worst month since 2000, down 34% on AI-spending fears. But Azure's still up 40%, AI revenue tripled to $37B, and stripping the growth build out turns a 39×FCF stock into a 21× one.

Microsoft at 39x FCF looks expensive, exactly like Amazon through a decade of heavy capex.
Everyone knows Microsoft. You probably touched three or four of its products before lunch an Outlook inbox, a PowerPoint deck, or a Teams call,. That kind of company doesn’t usually go on sale as it is now.
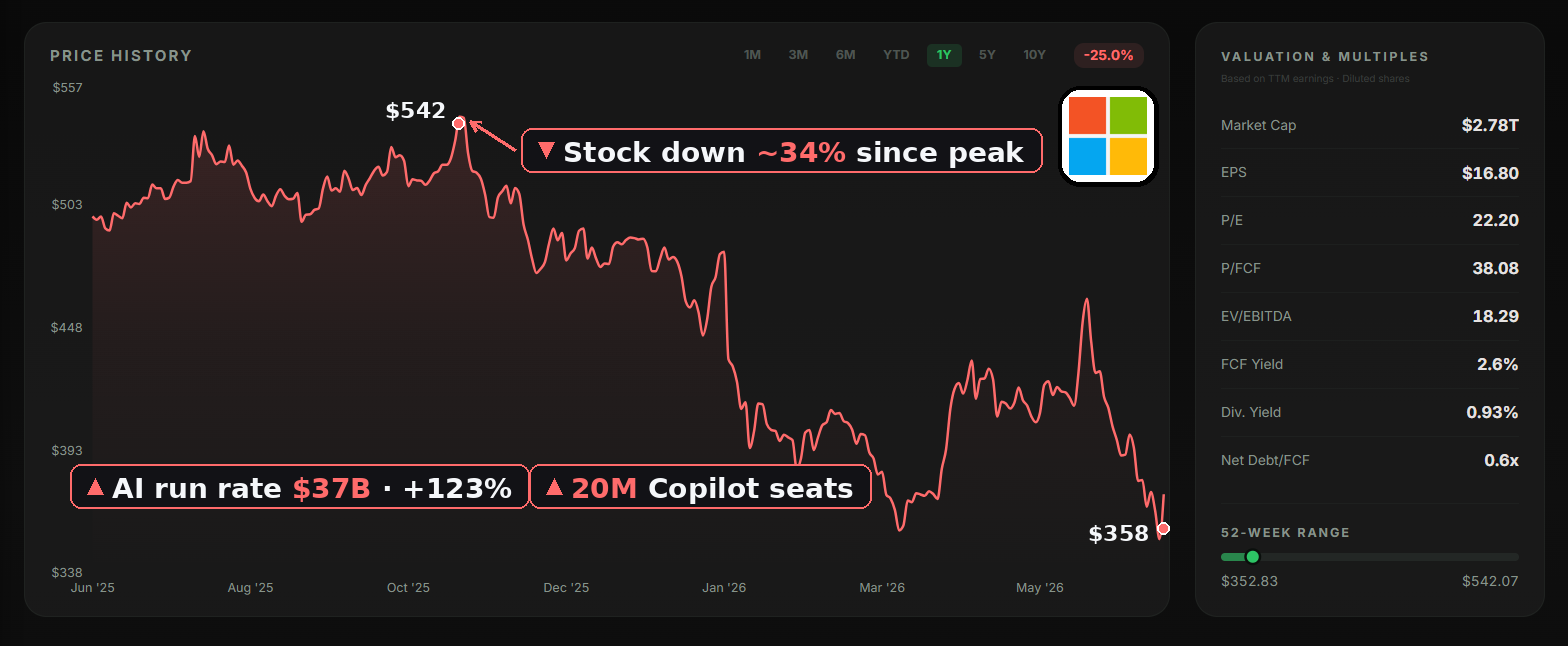
Chart 1. MSFT's monthly closing price since October 2025. After peaking at $539 in late October, fell 21.6% in June alone — the steepest single month drop since December 2000. Chart Source: intrinsiqq.com
Microsoft just had its worst month as a public stock since 2000. The shares closed at $352.83 on June 25, down about 34% from their October high near $539. The main reason is Microsoft is spending a staggering amount of money building AI data centers, and that spending has crushed its reported free cash flow. The market looks at the cash that’s left, and calls the stock expensive.
That’s the consensus, and I think it’s wrong. By FCF measure the stock looks expensive. But free cash flow is the wrong lens for a company in the middle of the biggest build in its history. The right one is owner’s earnings and on that lens, the very same stock is cheap. The whole contribution of this post is that switch: change the denominator from “cash left over after the build” to “cash the business actually earns,” and “expensive” turns into “on sale.”
Here’s the path the rest of this piece takes:
Microsoft’s moat — switching costs, scale, and the two real networks
Is the AI capex actually turning into revenue? — following the $190B build for 2026.
Valuation — 39× free cash flow, or 21× owner’s earnings?
The DCF — what Microsoft is worth, and what you’d make buying today
Microsoft’s Moat: Switching Costs, Scale, and Two Real Networks
Microsoft holds three product revenue lines:
Productivity & Business Processes. The work software: Microsoft 365 (Word, Excel, Teams, Outlook), LinkedIn, and Dynamics. About 450 million paid commercial seats, sold mostly as multi-year subscriptions. This is the most profitable part of the company.
Intelligent Cloud. Azure, the server software businesses, and GitHub. This is the AI build everyone is watching, and it now does as much revenue in a quarter as the work software does.
More Personal Computing. Windows, Xbox, and Bing. The legacy bucket and it’s actually shrinking.

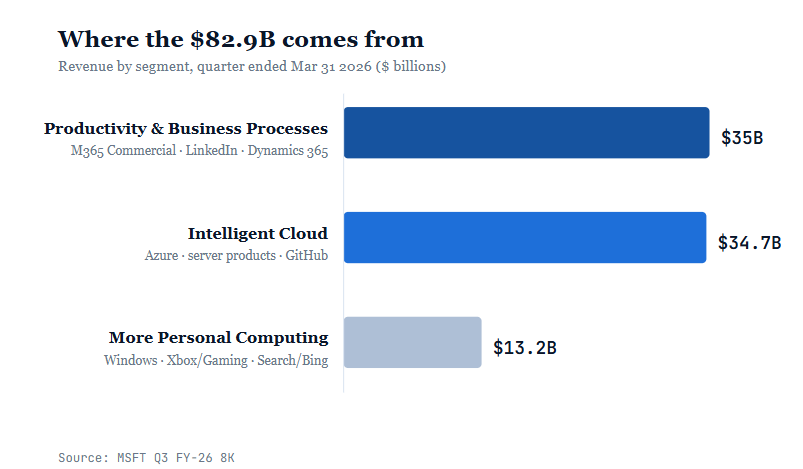
Chart 2. Microsoft's $82.9B in Q3 FY26 revenue by segment. The work software and Intelligent Cloud are now roughly the same. Source: MSFT Q3 FY26 earnings.
The Microsoft Moat is different in three ways, and it’s worth outlining each one because they don’t all work the same.
The first is switching costs. Once a company runs payroll, email, security, and compliance through Microsoft 365, leaving isn’t a purchasing decision — it’s a year-long migration. That’s why about 97–98% of the commercial revenue is recurring, locked-in subscription money.
The second is scale. Microsoft runs more than 400 data centers, and the cost to build cloud infrastructure at that level is so large that, that most companies couldn’t pay. That cost of entry is itself a moat.
The third defense is network effects. Let me be exact about that, because The Equivara Portfolio owns network-effect businesses and I want to compare it like so.
A real network effect means the product gets more useful as more people use it, which pulls in still more people. For example, Klarna: every shopper it brings makes Klarna more worth offering at checkout, and every merchant that adds Klarna gives shoppers another reason to use it. Shoppers pull merchants; merchants pull shoppers.
Microsoft has network effects in two specific places:
LinkedIn is a two-sided network: 1.2 billion members make it the one place recruiters and advertisers have to show up, and that spending makes it the place professionals have to keep a profile.
GitHub is the developer version, roughly 150 million developers, the code they share, and now a Copilot trained on all of it; more developers make it more useful, which draws more developers.
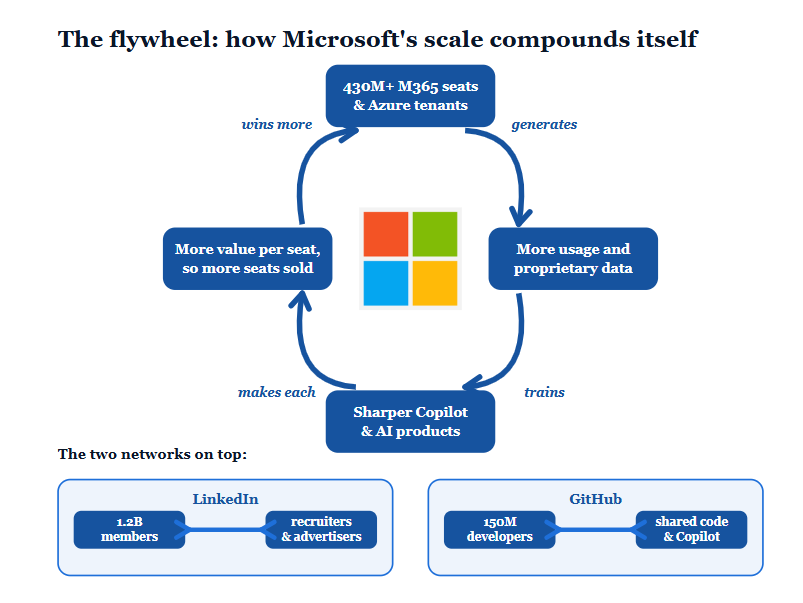
Chart 3. Microsoft's Azure flywheel. 430M users generate proprietary data, which trains sharper Copilot and AI products, which make each seat more valuable, which wins more seats and the loop repeats.
But that is not where most of Microsoft’s money comes from. Office, Windows, the server business, Azure those aren’t networks. They’re held by switching costs and scale. So, the accurate version I’d argue is: MSFT has two genuine networks integrated onto a much larger business whose defense is switching costs and scale. That's a different kind of moat than a pure marketplace like Klarna, and a more durable one — Microsoft would still be a fortress if both networks vanished tomorrow.
The market is questioning AI eats seat-based software, Anthropic’s Excel and PowerPoint add-ins are already more loved than Microsoft’s own. It’s a valid worry because the early Copilot numbers are soft, a year ago Microsoft had only about 15 million paid Copilot seats against a base of 450 million, just 3% of its commercial user base.
But the picture is changing in the industry, for decades software was sold by the seat: a fixed price per person per month, no matter how much they used it. With AI, the industry is moving to usage-based pricing instead, where you pay for what the software actually does. Salesforce launched Agentforce at $2 per conversation, then switched to "Flex Credits" at about ten cents per action, that business is already at a $540M run rate, up 330% in a year. Even Figma, a classic per-seat design tool, has layered a usage based AI tier on top of its seats. The pattern is identical everywhere add an AI layer ontop of your existing product, charge for consumption, and revenue starts scaling with how hard people lean on it. Microsoft is on the same path. GitHub Copilot moved to usage based pricing on June 1, about 60% of Copilot customers are already on consumption credits.
Is AI capex actually turning into more revenue?
The question isn't whether Microsoft is spending a fortune because it obviously is. The question is whether that money is turning into more revenue and at what pace.
Microsoft quarterly capital spending climbed from about $21B a year ago to a peak of $37.5B last quarter. For all of calendar 2026 the company guided to roughly $190B, up about 61%, and told investors about $25B of that increase is just higher prices for memory and components, not extra capacity. That guide is the single number that triggered the selloff.
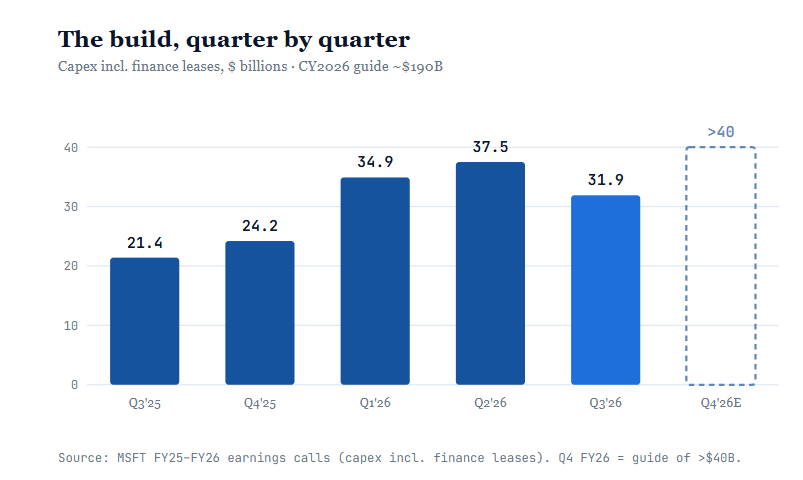
Chart 4. Quarterly capital spending including finance leases. It roughly tripled in a year and stays elevated; the dashed bar is the Q4 guide of more than $40B as new capacity comes online. Source: MSFT FY25–FY26 earnings calls.
Now where is that money showing up? Azure, which grew about 40% last quarter, accelerating, not decreasing, and it keeps growing in the high-20s for six straight quarters. The broader AI business went from a $13B run rate at the end of 2024 to $37B this spring. And the contracted backlog (revenue customers have already committed to but Microsoft hasn't booked yet) sits at $627B, nearly double a year ago. To be honest, you don't sign up for $627B of future cloud commitments unless the build is producing something customers want to pay for.
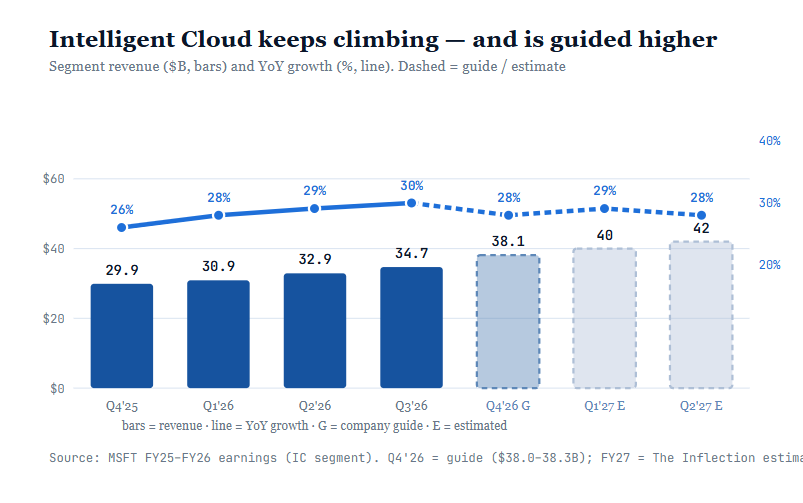
Chart 5. The return on the build: Intelligent Cloud revenue has climbed every quarter while YoY growth held in the high-20s, and management guides it higher again next quarter ($38.0–38.3B). The two faint bars are estimates extending the guided trajectory into FY27. Sources: MSFT FY25–FY26 earnings.
However and this is a real risk worth breaking down about 45% of that $627B backlog is OpenAI. Backlog is a promise, not money in the bank, and OpenAI is loss-making company funding itself through enormous raises. Microsoft and OpenAI have already renegotiated their arrangement more than once. So a big slice of that committed backlog rests on OpenAI funding and their partnership loyalty.
If you want to see what single customer dependence looks like when it's the whole story, look at CoreWeave. Microsoft was about 62% of its 2024 revenue and roughly 67% in 2025, the top risk factor in its IPO filing was "if one customer leaves, the business breaks." A renegotiation, a cancellation, or that customer simply deciding to build its own capacity would take the forecast down with it. That’s bear sharpest point on Microsoft and I wont disagree with them.
The difference is OpenAI is 45% of the backlog line not 45% of Microsoft revenue. The actual company earns more than $280B a year across Office, Windows, security, and hundreds of thousands of Azure accounts that have nothing to do with OpenAI; strip OpenAI out and the rest of the backlog still grew 28%. So this isn't CoreWeave's existential bet, it's one concentrated line item on an otherwise diversified fortress. But it is real, it is why the market is right to critique the backlog number.
Here's where the spending physically goes. When Microsoft buys a data center, the cost does not reflect in the income statement all at once but gradually, it first shown on the balance sheet as property and equipment, then into profit slowly over years as depreciation. On the graph below: net property and equipment jumped from $205B last June to $283B by March.
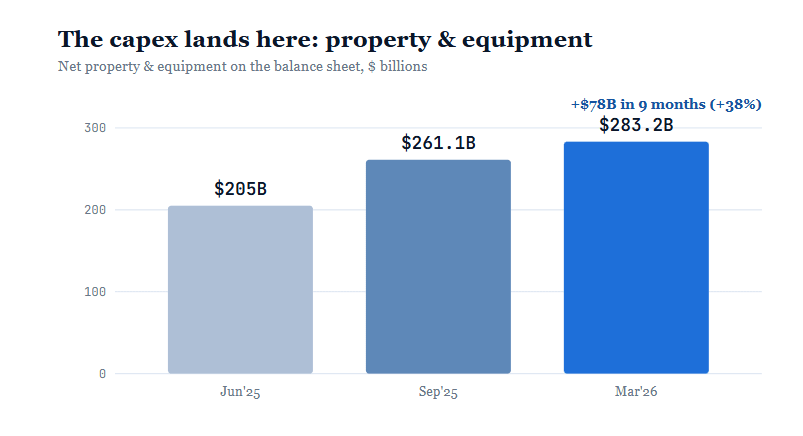
Chart 6. Where the capex lands: net property & equipment grew $78B (+38%) in nine months. The rising depreciation on that base (accumulated depreciation went from $94B to $112B) is what flows through reported earnings. Source: MSFT 8-K balance sheets.
Valuation: 39x FCF or 21x Owner Earnings?
Reported profit and reported cash flow both mislead you when a company is building hard. The fix comes from one Warren Buffet concept, he calls it owner's earnings: how much cash could the owner take out of this business in a year without weakening it? You start with the cash the business actually generates. Then you subtract only the spending it truly needs to keep its current earning power intact. Whatever's left is owner's earnings.
The part that matters for Microsoft is what you don’t subtract. Money spent to grow, like new data centers that aren't serving customers yet, isn't a cost of staying in business. And you should judge a choice by the return it earns, not bury it in the running costs and pretend the company got poorer. When you separate the spending that keeps Microsoft running from the spending that's building its future, the stock stops looking expensive and starts looking like a compounder on sale.
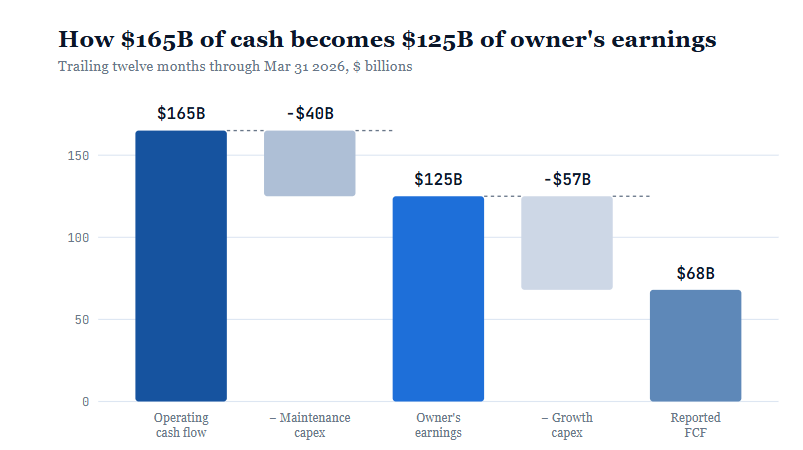
Chart 7. The owner’s earnings calculation. Start with ~$165B of operating cash flow, subtract only the ~$40B of maintenance capex it takes to keep today’s revenue running, and you’re left with ~$125B. Reported free cash flow $68B subtracts the $57B of growth capex . Source: Maintenance figure is an estimate; the rest is from filings (TTM through Mar 31, 2026).
That’s why owner’s earnings is the right lens here. Microsoft is in the middle of the biggest building record in its history. Reported free cash flow is roughly $68B over the last twelve months, which against a $2.62T market cap works out to about 39 times cash flow, genuinely expensive. But strip out the part that’s pure growth, and the same company is doing about $125B of owner’s earnings. That’s roughly 21 times. Microsoft trades near 21× the cash it really earns, while still growing revenue 18%.
One multiple is not clear for a company spending like this, so look at three earnings metrics:
Trailing P/E — 20.9×. $125.2B of trailing net income is $16.85 a share; at $352.83 that’s 20.9×.
Forward P/E — 18.2×. FY27 consensus earnings sit near $19.40 a share; the multiple falls to 18.2× on next year’s numbers.
Price / owner’s earnings — 21.0×. ~$125B of owner’s earnings is ~$16.82 a share, essentially on top of net income — 21.0×, the cash-based confirmation of the earnings number.
So on every earnings-based measure, you’re buying one of the best businesses in the at nearly half off its normal price, while it still grows revenue 18%.
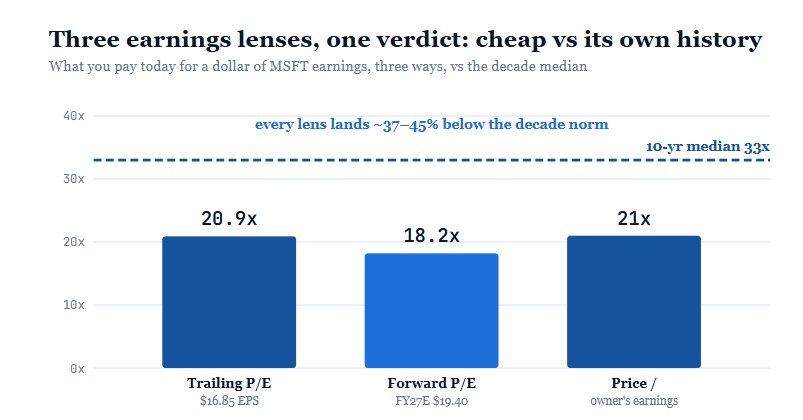
Chart 8. The same business under three earnings lenses against its own decade median of ~33×.
What’s Microsoft Actually Worth?
Assumptions:
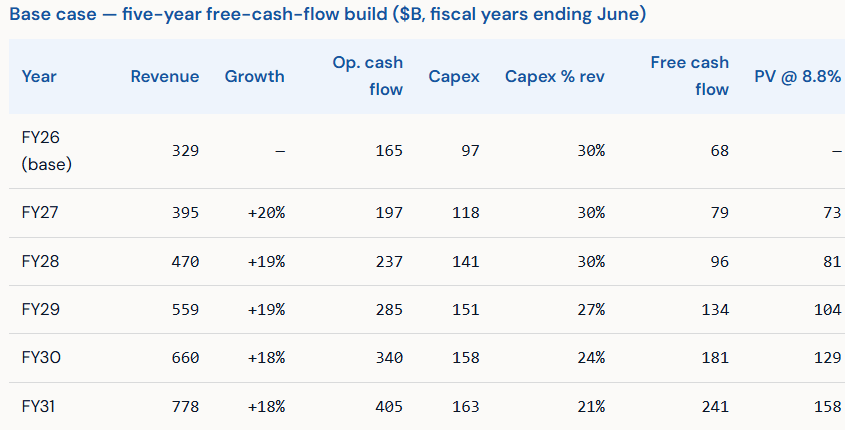
FY26 revenue of about $329B.
Revenue growth: a base case where the AI layer keeps the top line compounding around 20% next year, fading to 18% by FY31.
Cash-flow margin: operating cash flow at about 50% of revenue, drifting up a point or two as scale builds.
Capital spending: Im not leaning to a fast normalization. I hold capex near 30% of revenue through FY27 and FY28, because the build isn’t slowing while demand still outruns capacity, then let it ease to 27%, 24%, and 21% by FY31.
Discount rate: a dollar arriving five years out is worth less than a dollar today, so I discount future cash back at 8.8% a year.
Terminal value (4.0% growth): the business doesn’t stop in FY31. The terminal value captures every dollar of cash flow after that, assumed to grow ~4% a year in perpetuity,and discounts back to today.
Sum the discounted cash flows, add ~$40B of net cash, divide by 7.43B shares.
One thing you should read carefully: the bear case of $317 doesn't mean “the stock falls to $317 five years from now”; it means “if the bear assumptions hold, the company is worth $317 right now, so at $352.83 you're paying about 10% too much.” The return column answers the question that matters to a buyer: pay today's $352.83, hold five years while the gap to fair value closes and the business keeps compounding, and what do you earn per year?
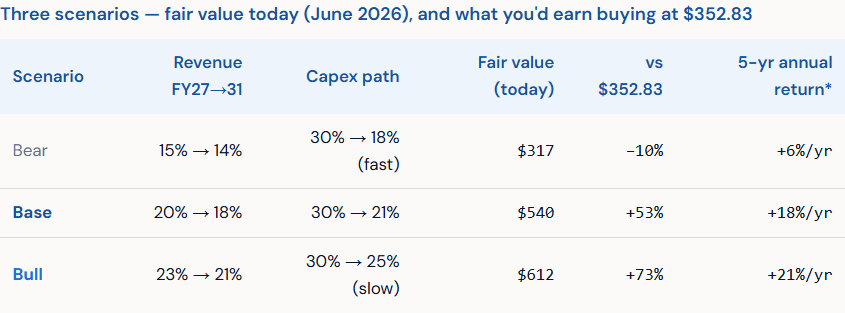
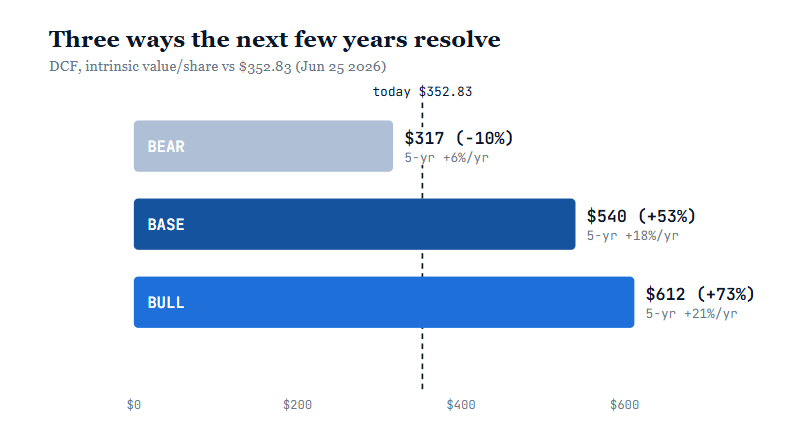
Chart 9. Fair value today under each scenario against the June 25 close ($352.83), with the five-year annual return beside each.
So what does this mean if you’re the one deciding whether to buy at $352.83 today? Two things.
First, look at your worst case. The bear assumes growth slows to the mid-teens and a price war squeezes Microsoft’s cloud margins. Even then, the business is worth $317 today — only about 10% under what you’d pay — and because it keeps growing the whole time you hold it, that bear still pays you roughly 6% a year over five years.
Second, look at what you’re actually betting on. You are not betting that Microsoft set up brakes on spending. The base case, worth $540 (about 53% above today’s price), already assumes capex stays pinned at 30% of revenue through FY28 and the slow normalization. So the only thing you’re really betting on is that the spending stops climbing while revenue keeps compounding.
Put those together and you have the setup every value investor is hunting for: a downside you can live with, and a base case that doesn’t need anything extraordinary to go right.
The Bottom Line
Microsoft’s worst month since 2000 came from one number FCF being crushed by a data center build that is less a cost than a bet on the next decade. It’s the same misread the market is making with two lenders I’ve already taken a deep-dive here, Klarna and MercadoLibre: accounting forces a lender to book a loan’s full expected loss the day it’s written, so a fast-growing book front-loads the provision and back-loads the credit revenue. Earnings look worse the faster it grows, and the market punishes that upfront charge exactly as it punishes Microsoft’s upfront capex — provision first, revenue later.
Measure Microsoft on owner’s earnings instead of free cash flow and the 39× that looks expensive becomes about 21×, against a 33× decade norm, for a company still growing mid-teens. Even pinning capex at 30% through FY28, the base case is worth about $540, roughly 53% above today. One risk worth flagging is OpenAI is ~45% of the backlog. But this reminds me the setup the market set on Google when it called Chat-GPT the end of Search and Google doubled. Is Microsoft doubling next?
Disclosure: I do not currently own MSFT. Current holdings: NU, SOFI, CHIME, HOOD, KLAR, PLTR, QXO, CRWD, NET, and RBRK. This is my personal investment thesis, not investment advice; I am not a registered investment or financial adviser, and nothing here is a recommendation to buy or sell any security. Do your own research and size positions to your own risk tolerance. Figures come from Microsoft's SEC filings and earnings materials (trailing twelve months through March 31, 2026) and public market data anchored to the June 25, 2026 close of $352.83.
The 8.8% discount rate might be worth revisiting given the OpenAI concentration risk flagged earlier in the piece- a slightly higher rate in the bear case could make that scenario's downside feel more consistent with the risk described.